Managing IT services effectively is a critical priority for modern organizations. From incident resolution to SLA compliance, IT teams must ensure that business operations remain smooth and uninterrupted. However, tracking all service activities manually can quickly become overwhelming. That’s where an ITIL Dashboard Template in Excel comes into play.
An ITIL dashboard provides IT managers and service desk teams with a centralized view of KPIs, incidents, problems, changes, and service requests. By leveraging this ready-to-use Excel template, businesses can monitor IT performance, identify bottlenecks, and ensure compliance with ITIL best practices—all without the need for expensive software.
What is an ITIL Dashboard?
An ITIL dashboard is a visual reporting tool that captures key metrics related to IT service management (ITSM). Built around ITIL (Information Technology Infrastructure Library) frameworks, the dashboard enables teams to track performance across:
-
Incident Management
-
Problem Management
-
Change Management
-
Service Request Fulfillment
-
SLA (Service Level Agreement) Compliance
With pre-designed charts and automated data tables, this Excel-based template makes IT performance monitoring simple, efficient, and highly customizable.
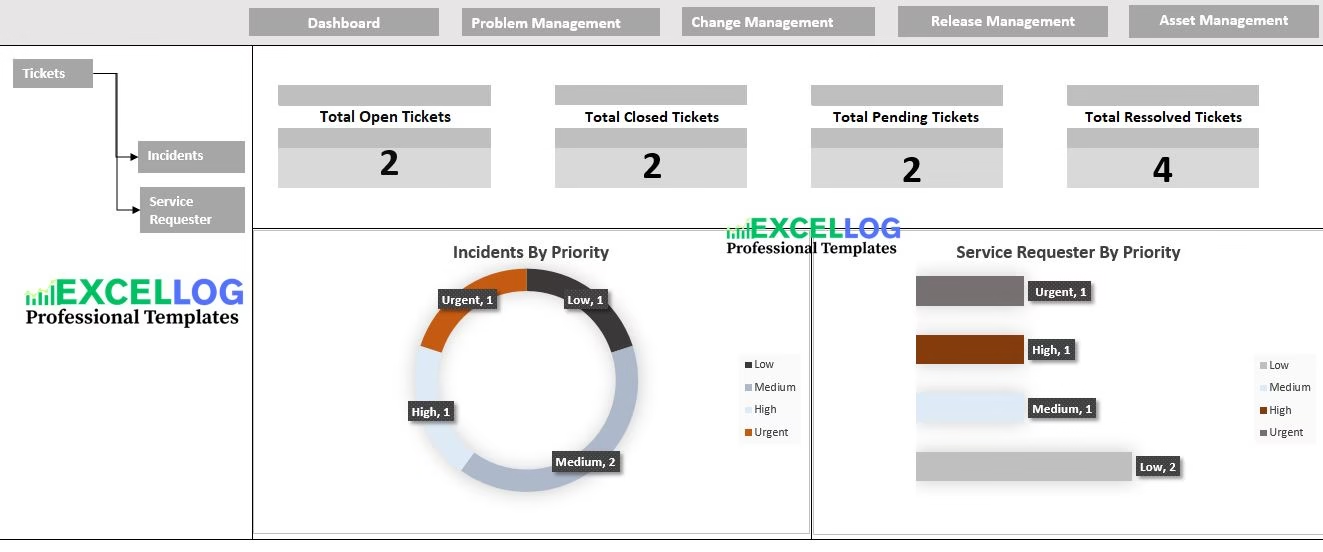
Key Features of the ITIL Dashboard Template
This template includes multiple modules tailored for ITIL processes. Some of the core features are:
-
Incident Tracking
-
Monitor total incidents, open vs. closed cases, and resolution trends.
-
Prioritize incidents based on severity (critical, high, medium, low).
-
Improve Mean Time to Resolve (MTTR) with data-driven insights.
-
-
Problem Management
-
Identify recurring issues and track root cause analysis.
-
Record corrective actions and long-term solutions.
-
Reduce downtime by addressing problems proactively.
-
-
Change Management
-
Log all requests for change (RFCs) with approval workflows.
-
Track successful vs. failed changes.
-
Measure implementation time and impact on services.
-
-
SLA Monitoring
-
Track SLA adherence for incidents and requests.
-
Calculate resolution time against agreed benchmarks.
-
Maintain compliance with service contracts.
-
-
Interactive Dashboard Visuals
-
Pie charts for ticket distribution.
-
Bar graphs for monthly trends.
-
KPI scorecards for quick insights.
-
Benefits of Using an ITIL Dashboard
Implementing this dashboard brings measurable value to IT operations:
-
Improved Decision-Making: Real-time visibility into IT performance helps managers make faster and smarter decisions.
-
Cost Savings: By identifying recurring problems, businesses reduce downtime and optimize resource usage.
-
Better SLA Compliance: Automated tracking ensures SLAs are consistently met, strengthening client trust.
-
Team Productivity: IT staff can prioritize tasks effectively and focus on critical issues first.
-
Data-Driven Culture: Insights from the dashboard empower continuous service improvement.
Why Choose an Excel-Based ITIL Dashboard?
Many businesses invest in costly ITSM software, but not every organization has the budget or resources to implement large-scale solutions. An Excel ITIL Dashboard offers a lightweight, affordable, and easy-to-use alternative.
Advantages of using Excel:
-
No Additional Software – Works with MS Excel, which most organizations already use.
-
Customizable – Users can modify formulas, KPIs, and layouts as per business needs.
-
Scalable – Suitable for both small IT teams and enterprise-level operations.
-
User-Friendly – Requires minimal training to implement.
How to Use the ITIL Dashboard Template
-
Download the Template
Start by downloading the pre-built ITIL Excel dashboard. -
Enter IT Service Data
Input details for incidents, problems, change requests, and SLA targets. -
Monitor KPIs
The dashboard auto-generates reports and charts based on entered data. -
Analyze Trends
Identify recurring problems, SLA breaches, and resource bottlenecks. -
Take Action
Use insights to optimize IT processes and improve customer satisfaction.
Who Can Benefit From This Dashboard?
-
IT Managers: Gain real-time insights into team performance.
-
Service Desk Teams: Track workloads and prioritize tickets.
-
Business Leaders: Understand IT’s contribution to business outcomes.
-
Consultants: Provide clients with ready-to-use ITIL compliance tools.
👉 Download the ITIL Dashboard Template in Excel today and take control of your IT service management