Sales dashboard is a powerful tool that turns raw sales data into actionable insights. Whether you’re tracking revenue, analyzing product categories, or measuring performance over time, a dashboard helps you make smarter business decisions.
In today’s fast-paced business world, data isn’t just important—it’s essential. Companies that track, analyze, and act on their sales data can outpace the competition, improve customer satisfaction, and maximize profits. One of the most effective tools to achieve this is a sales dashboard.
What Is a Sales Dashboard?
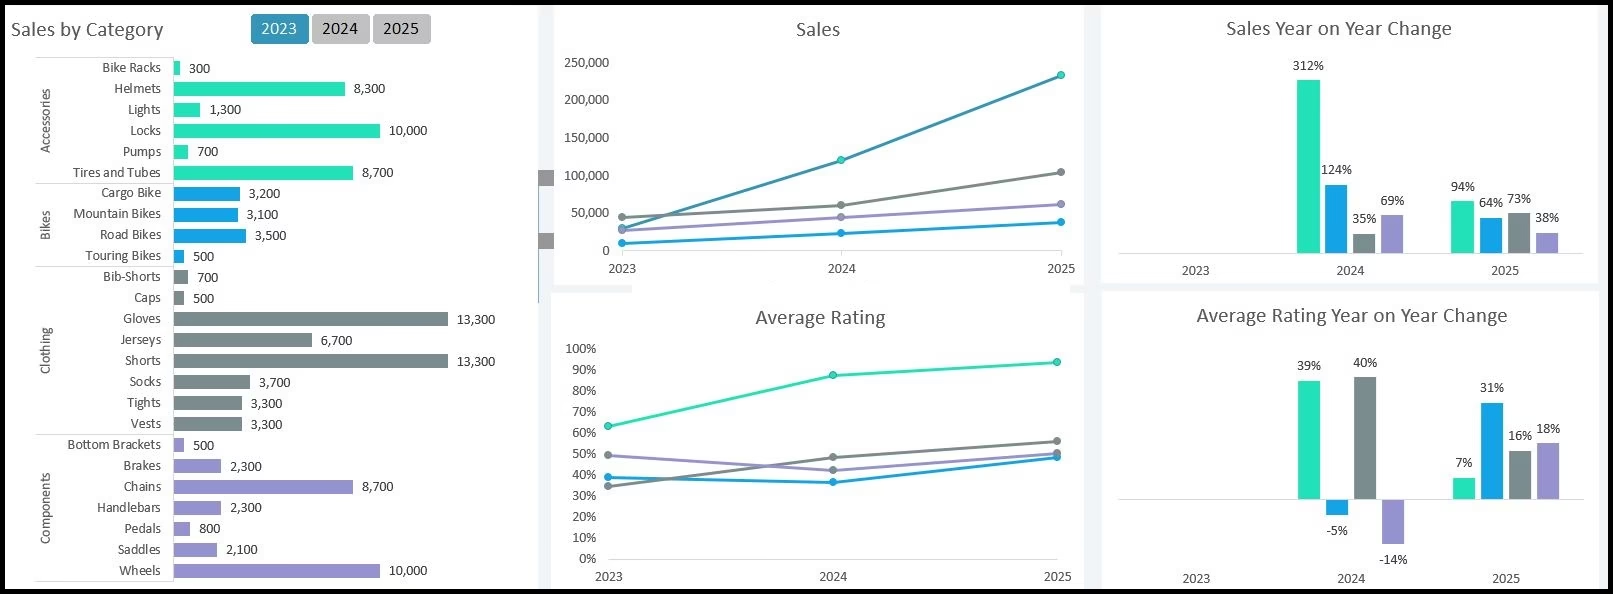
A sales dashboard is a visual reporting tool that brings together your key performance indicators (KPIs)—such as revenue, product category sales, and performance ratios—into one easy-to-read view. Instead of spending hours going through spreadsheets, you get an instant snapshot of your business performance.
Think of it as the command center for your sales strategy: a place where you can check growth trends, track product categories, and spot patterns that influence decision-making.
Evaluating Product Ratings and Performance
A strong dashboard doesn’t just stop at revenue numbers. It can also include ratings and ratios, which show how well products are performing beyond just sales.
For example:
-
High-rated products like Helmets and Tires stand out as customer favorites.
-
Other products may sell less but still hold strategic value in the catalog.
Monitoring these performance indicators helps businesses decide which products to prioritize, promote, or even phase out. It also supports better inventory management—ensuring high-demand items are always in stock.
Making Data-Driven Decisions
When all your sales insights are in one place, decision-making becomes clearer and faster. Here are just a few ways a sales dashboard empowers businesses:
-
Spot Trends Quickly: Identify rising product categories before competitors catch on.
-
Focus on Profitability: Highlight high-margin products, not just high-volume sellers.
-
React Faster: Detect downturns in sales early, so you can adjust campaigns immediately.
-
Plan for the Future: Use historical sales data to forecast demand and set realistic growth goals.
Instead of relying on guesswork, you’ll have hard data to back every business move.
How to Use This Sales Dashboard
The sales dashboard we analyzed is designed with four key sheets, each with a role in keeping data clean and insights accurate:
-
New Data Sheet
This is where you input fresh sales information, such as yearly or monthly figures. -
Database Sheet
This sheet consolidates the raw data, creating a central source of truth. -
Workings Sheet
Behind the scenes, calculations are performed here—totals, growth ratios, and category comparisons. -
Dashboard Sheet
The polished, visual view where all insights are displayed clearly.
👉 To use the dashboard effectively, simply add your new sales entries in the New Data sheet. From there, the system automatically updates the Database, performs calculations, and refreshes the Dashboard view. No manual number-crunching required.
Why Every Business Needs a Sales Dashboard
Without a dashboard, sales reporting often involves multiple spreadsheets, manual calculations, and inconsistent data. This not only wastes time but also increases the risk of errors.
With a dashboard, you get:
-
Real-time visibility of your sales performance
-
Fewer mistakes thanks to automation
-
Time savings—so you can focus on strategy instead of spreadsheets
-
Clarity in decision-making
Whether you’re a small business looking to scale or a large company managing multiple product lines, a sales dashboard gives you the edge you need to compete in a data-driven marketplace.